
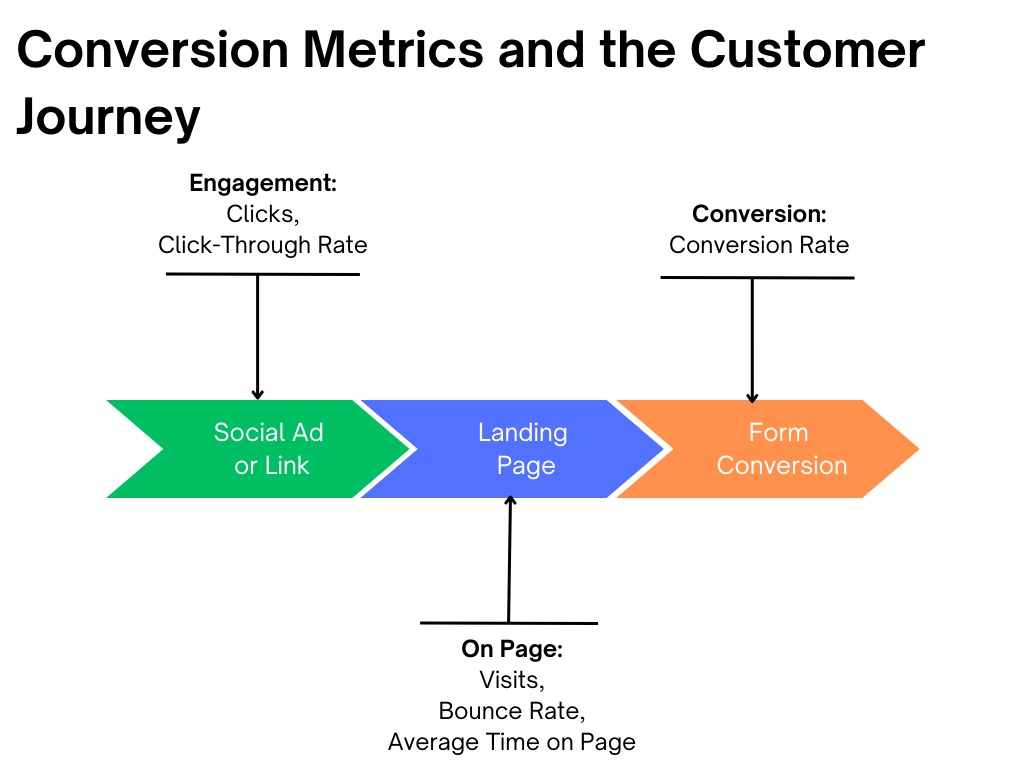
TL;DR: Landing pages. Their primary reason to exist is to convert customers. Treating your landing page like a science experiment is important: testing, making adjustments and measuring results. Some key analytics will tell you how well your landing page does the job you built for.
So what? What is a landing page? It is the East, and conversions are the sun. Average engagement rates, scroll depth, traffic statistics… these metrics should become your new second language to make your landing pages work for you. Here, we’ll give you a breakdown of what to look out for and why.
Introduction
Landing pages are critical to the success of business websites because most marketing campaigns funnel into them. Accordingly, they must make metrics tracking essential.
In this blog post, we delve into why you need to monitor these analytics to optimize conversion. We’ll also discuss a variety of measurements you can use to gauge the success of your page, including click-through rates, bounce rates, conversion rates, and more.
Top Landing Page Analytics in 2023
The Top 7 Landing Page Metrics to Track
Here are the Big 7, in order of importance. We’ll cover each of these below, along with industry averages and examples of brands that do it well.
- Conversion Rate
- Average Engagement Rate/Bounce Rate
- Average Time on Page
- Traffic Sources
- Keywords
- Device Profiles
- Geolocation
(Note that click-through rate is an important metric, but this happens before the landing page, so we cover that elsewhere.)
Conversion Rate
What percentage of landing page visitors take action?
For most digital marketers, Conversion Rate is the most important metric, measuring the percentage of landing page visitors who take action, such as filling out a form or making a purchase. A high conversion rate indicates that your landing page is doing its job. A low conversion rate means people are clicking away, and it suggests that you need to improve your page design, content and/or offer.
According to Campaign Monitor, the average landing page conversion rate across industries is 2.35%. This can vary by offer and by industry, so we recommend establishing a benchmark conversion rate for your landing page, then improving on it by testing new offers and designs.
Marketer Takeaway: Measure Conversion Rates using GA4, and try to beat 2.35% or an industry-specific average.
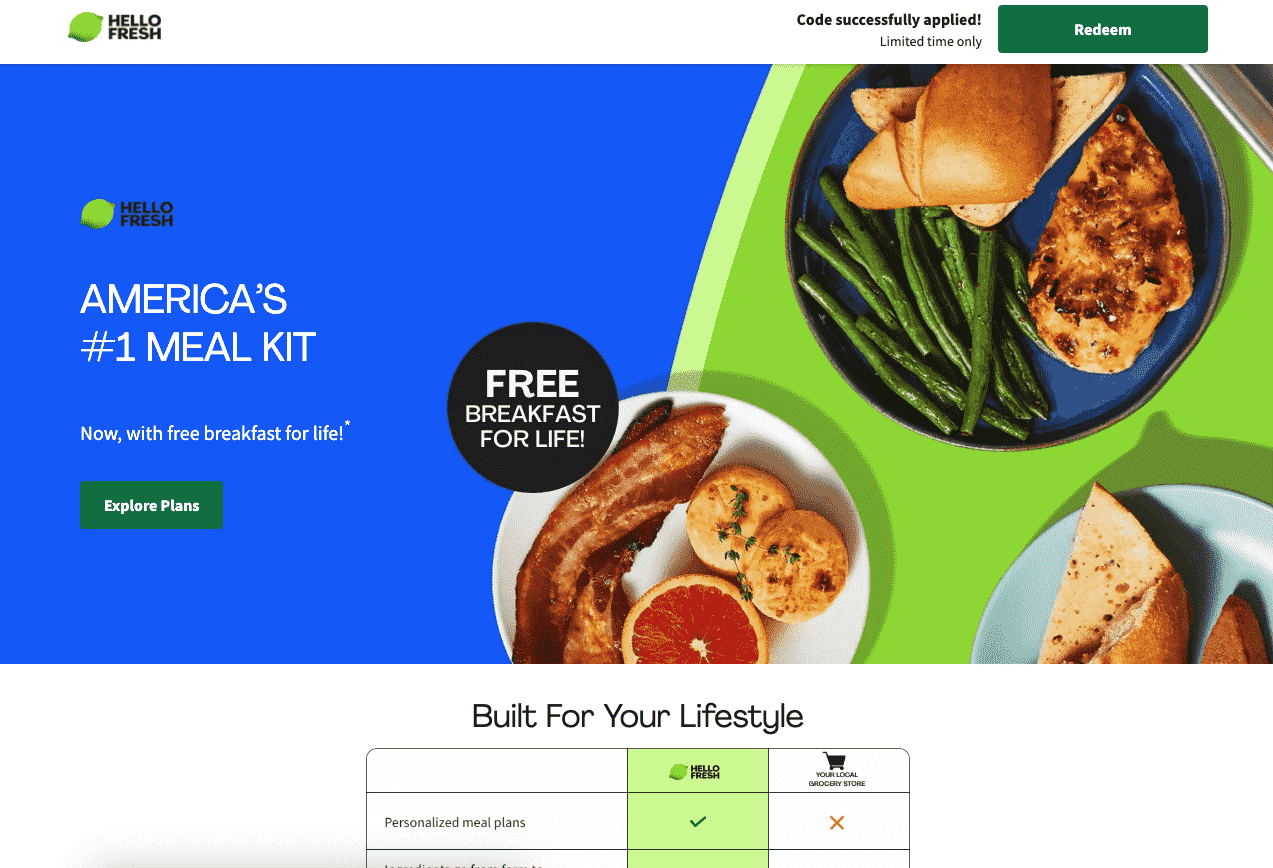
For example, HelloFresh runs a conversion-oriented landing page under the “healthy food delivery” search term. A front-and-center lifetime offer, alongside a plan selector, leads customers directly to a specific conversion: signing up for a delivery plan. The images of delicious food are just the sweetener for this offer.
Engagement Rate/Bounce Rate
How many viewers actually spend time on, or engage with, your landing page
How to Find it: Go to Reports >
Engagement Rate (as measured in Google Analytics 4) measures the percentage of visitors to your landing page who are “engaged.” With engagement rate, higher = better.
How does Google define engagement? An engaged session is a visit that lasts longer than ten seconds, has a conversion event, or at least two pageviews.
The more engaged, the more clicks, pageviews, and form submissions you get. The average engagement rate is between 1% and 3.5%, according to marketing reporting company DashThis. Getting a low engagement rate could signify a need for more interesting content, or a better offer, on your landing page.
Bounce Rate is the percentage of visitors who navigate away after viewing just one page. With bounce rate, lower=better.
The average bounce rate range for landing pages is 60%-90% (Csource). Since the higher the bounce rate, the more potential customers you lose, your goal should be to beat this average.
Marketer Takeaway: Measure the engagement rate of your landing pages using GA4, and try to beat 3.5%.
A landing page that does this well

As an example, Serenata Flowers has a simple and easy-to-understand landing page, with time-based Calls To Action (CTAs) that create a sense of urgency and seasonal uniqueness. Giving the user the choice of several CTAs can ensure that you get to a page to shop for those flowers. This can reduce bounce rates and increase page time by ensuring the customer can get somewhere quickly and easily. (Just remember, more choices can also mean fewer conversions.)
Average Time on Page
How much time, on average, do all visitors stay on your landing page?
The more time visitors spend on your landing page, the more likely they are to engage with your content and convert. With Time on Page, higher=better.
Unlike engagement rate, this metric doesn’t necessarily require interaction but measures how long your users spend on the page–which can benefit more information-dense or long-scroll pages.
According to Trew Marketing, the average time on a landing page is two minutes. This can vary greatly, however, depending on the length of the landing page, the industry, and the CTA. Rather than beating an “average” time on a page, it’s better to establish a baseline for your landing pages, and then look to improve on it.
Marketer Takeaway: Establish a benchmark for Time on Page with GA4, then try to improve on it, remembering that Conversion Rate should always take priority over Time on Page. If you can get a reader to spend roughly two minutes on your page (if they haven’t engaged with a CTA yet) then you’ve designed an interesting asset for potential leads.
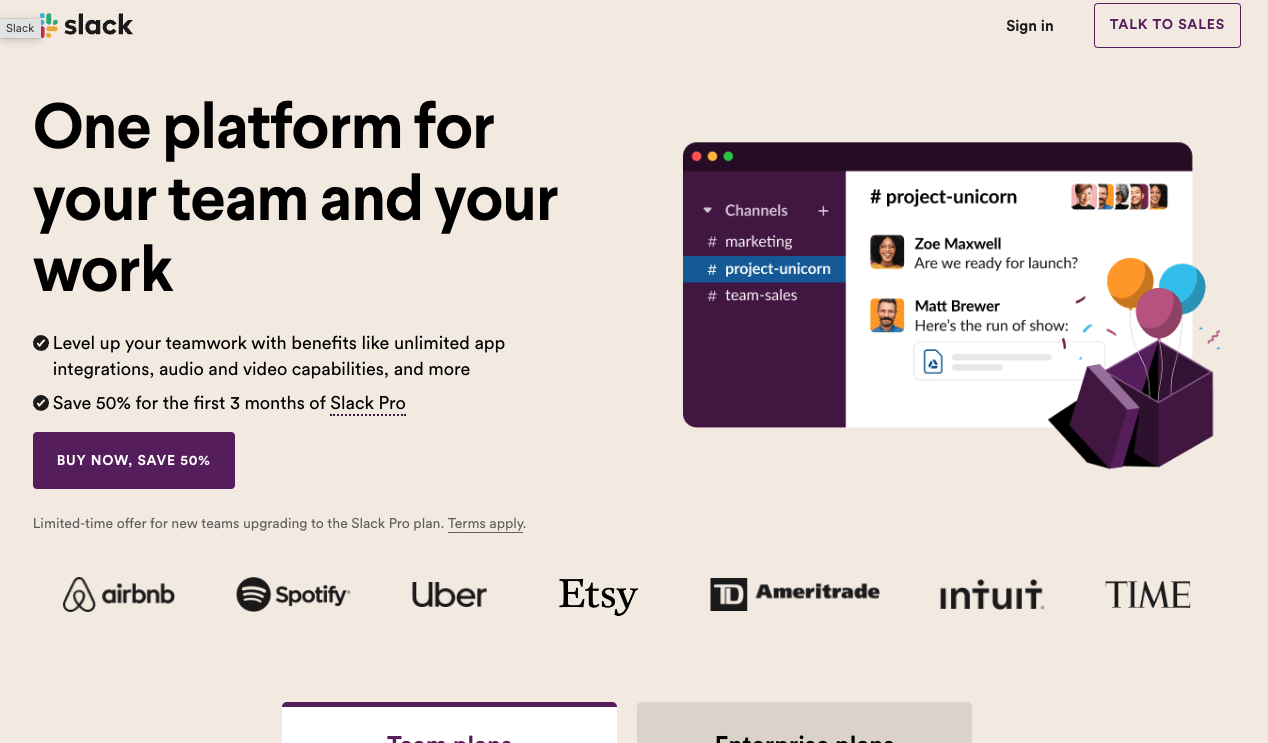
For example, the “free trial” landing page of work/communication platform Slack encourages conversion with its clean, simple design, limited color use, and concise but informative copy. This page makes signing up easy, but teases the reader with a clear bar with tons of information to draw interested customers who want to take some time to read more.
Traffic Sources/User Acquisition
Where are your customers coming from?
Traffic Sources (also called User Acquisition in GA4) categorizes how visitors came to your landing page. These sources include organic search, social media, paid advertisements, email campaigns.
When you know how most of your visitors find their way to your landing page, you can better gauge the effectiveness of the marketing channels that brought them to you. Then, you can allocate your marketing budgets accordingly.
Note that there is a form of traffic known as Direct Traffic. This category refers to traffic that has no known referral source. That is, they reached your site without going through another site, even Google. This might mean they typed your domain into their browser, had your site bookmarked, or if referring data was not passed by the user’s browser.

For example, this landing page from the writing tool Grammarly is designed to sign up visitors for a trial subscription.
Aimed at businesspeople and students wanting to improve their writing, Grammarly’s landing page features limited imagery, including a single photo of two professionals, with some small sample screen grabs of the software in action. It has standout white text on an uncluttered black background, and its headline and value proposition are both enticing and relevant to the intended audience.
The Grammarly page uses organic search, paid search, social media, email marketing, and a referral program to drive traffic and encourage free-trial signups – which the Grammarly team can measure using Traffic Sources or User Acquisition.
Marketer Takeaway: Determine a good baseline for traffic to your page and then try to improve on it week over week. While generally, more traffic is better, it’s critical to compare traffic with conversions to understand if that traffic is worth it. Also, if you’re receiving large volumes of direct traffic, it would benefit you to dig deeper into where it may originate from.
Keywords
Align page keywords with your advertising campaigns
The Keyword metric tells you which keywords (either paid or organic) drive traffic to your landing page.
Looking at keywords can help you judge whether your landing page is relevant to visitors’ search intent, which is especially important if you’re running a pay-per-click campaign. Seeing which keywords drive traffic can also help you ensure the landing page is optimized for SEO.
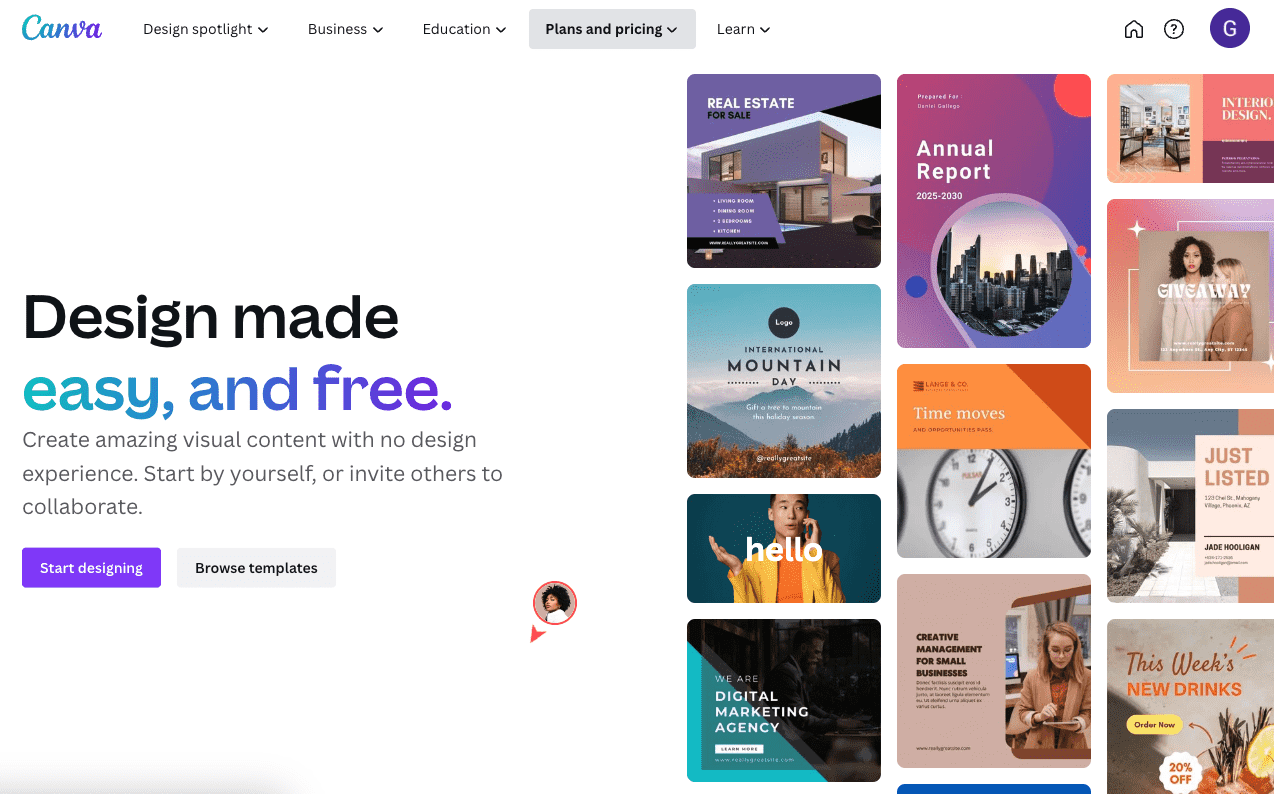
For example, the design platform Canva’s free-trial landing page has a compelling value proposition. The CTA is appealing and straightforward (“Start designing”) with a second option as a lower-stakes commitment (“Browse templates”).
Canva’s use of “design” here and some additional keywords (visual, designing, templates) wraps this into a compelling keyword experience, so that their users who click on those keywords in Google land on a page that immediately reinforces the thing they were searching for.
Marketer Takeaway: While this isn’t an SEO process, you can optimize your PPC campaigns by aligning advertising keywords with keywords on your landing pages.
Device Profiles
How are customers viewing your landing pages?
The device metric tells you the types of devices visitors use to view your landing page. It’s an important measurement to watch because different devices can impact landing page performance.
The most common devices for landing pages are desktop, mobile, and tablet (usually in that order). Be sure to view the page on each of these devices to be sure the experience is optimized for each experience.
Tracking the device metric for your landing page also lets you pinpoint the devices pushing the most traffic your way. This can help you determine where to direct resources to boost conversion rates.
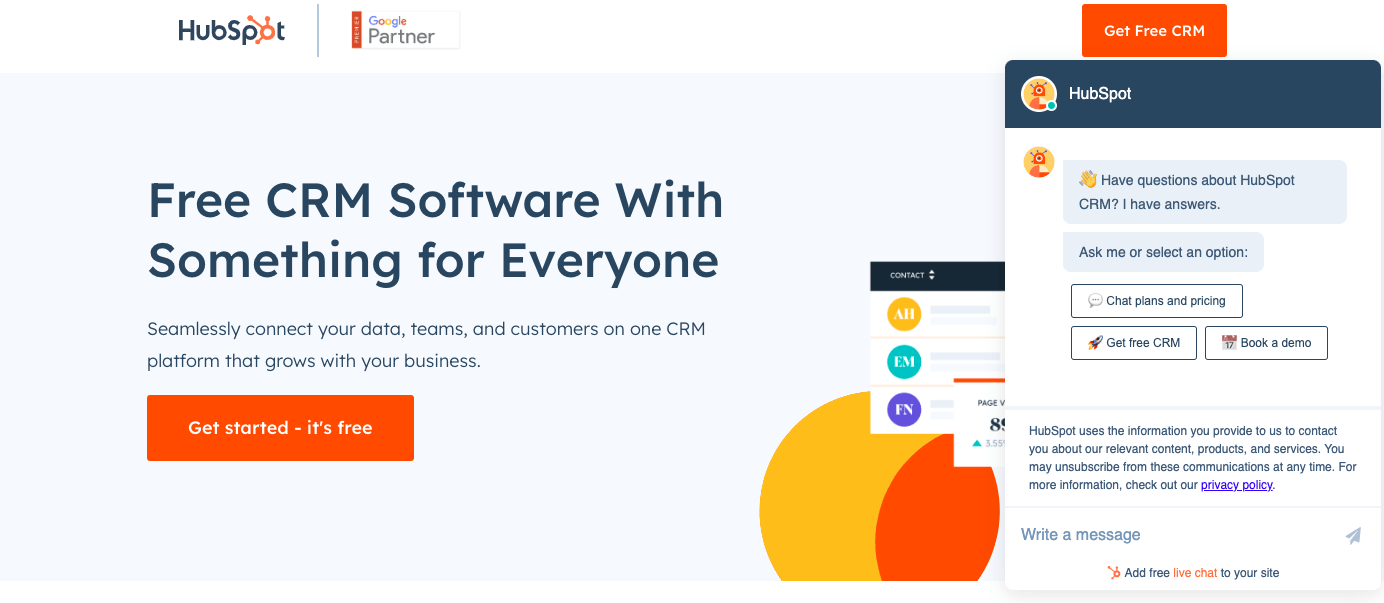
For example, the landing page for a free trial of HubSpot’s CRM software features a responsive design, so the page’s layout and content automatically adjust to fit the user’s screen. This ensures that the page is always easy to read, regardless of the device.
According to the company, 50% of users come to the HubSpot free trial landing page via a mobile device. This means the page is optimized for these users, who are more likely to convert than desktop users.
Marketer Takeaway: GA4’s Device Overlap report provides cool insights regarding how people view your content. Not only does this help you ensure you’re optimizing your page for the right audience (typically mobile audiences), but it also helps you get clear insight into how your target audience uses technology–a good reference for future ad campaigns.
Geolocation
From what regions do your customers interact with your landing pages?
The location metrics show you where your landing page visitors are physically located. (Or at least their servers, which are usually close enough.)
When you know where most of your visitors are located, you can better speak to local audiences, especially important for international businesses. Like the device metric, the location metric can be expressed as a number or percentage.
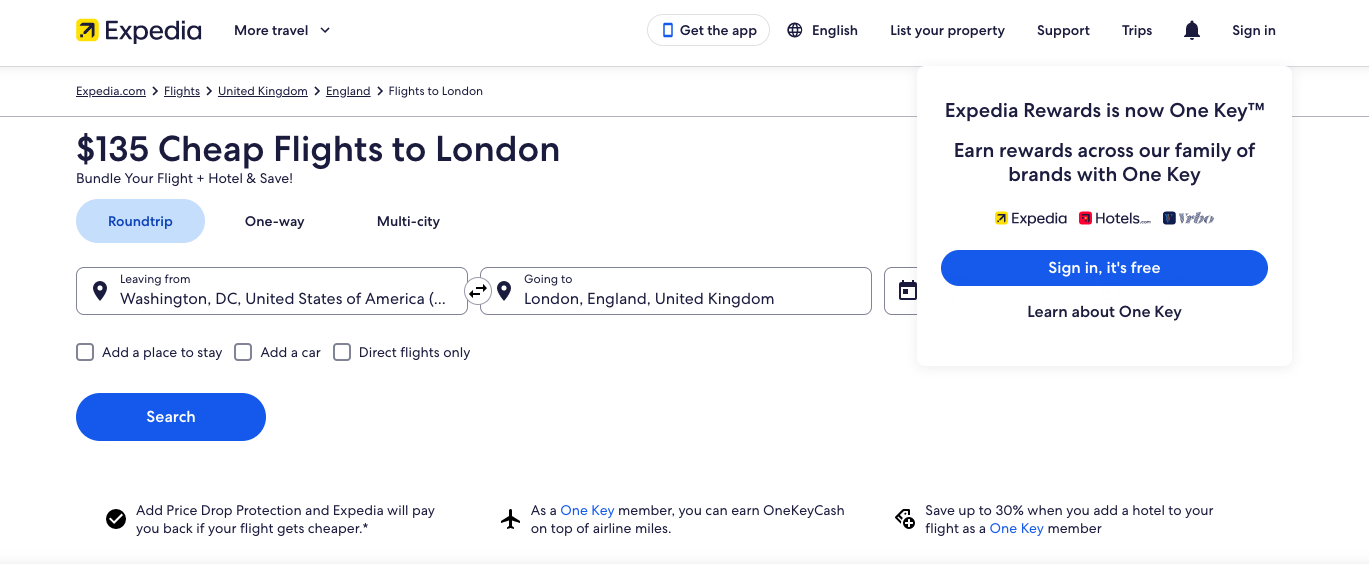
For example, Expedia’s cheap-flights-to-London landing page takes advantage of the high demand for this airline route with a simple, responsive design that increases the likelihood of visitors being able to access the page, regardless of their global location.
The page also uses other location-specific information, such as the best times to fly and pricing for flights from U.S. airports near the user. This information makes the landing page relevant and appealing to U.S. visitors. By tracking the location metric, Expedia can ensure the landing page uses real-time offers for users in different locations.
Marketer Takeaway: Demographic data can help you target local customers for local businesses, while providing location- and time-based experiences.
Scroll Depth Tracking and Engagement
How deep do customers read into your landing pages?
Scroll depth tracking measures how far down the page a visitor scrolls, which is information you can use to determine how engaged users are with your content. Are they scrolling far enough to see key links or forms, or are they losing interest early? According to brand content measurement company Nudge, a scroll depth of over 50% is above average.

For example, video streaming site Hulu’s free-trial-membership landing page is an effective case study for scroll depth tracking, for a few reasons.
- The page’s headline is a well-known and respected journalistic source quote that succinctly conveys a major benefit of signing up for the site’s services (“The best value for your money,” according to CNET).
- The background is made of images from popular TV shows you can watch with a Hulu subscription, which draws the user in.
- The page is easy to scan, with minimal white text that’s centered and stands out.
These techniques combine to keep users engaged and scroll down the page.
Marketer Takeaway: While above-the-fold CTAs are always preferred, a good scroll rate shows that your page contains good information to entice readers further into your page–where they can run into more opportunities to be “wowed” by your product (and encounter additional CTAs). 50% is a good benchmark for scroll depth.
How Can Marketers Optimize Landing Pages Using Analytics?
Once you’ve begun measuring and tracking the metrics above, here are our top tactics for improving landing page performance.
- Conversion Rate Optimization
Conversion rate optimization–refining landing pages to boost the percentage of visitors who take desired actions–is key to a more effective landing page overall. CRO consists of defining your goals, analyzing data, understanding your audience, creating compelling content, and simplifying forms, conducting testing, gathering feedback, and refining and measuring results.
- A/B Testing
In A/B testing, marketers make two versions of a landing page (A and B) with different elements, such as headlines, CTAs, and imagery. They then use analytics to determine which version results in higher conversion rates.
- Page Optimization Tools
Consider using page optimization tools to make the A/B testing process faster and easier. Popular options include:
1. Optimizely
2. Crazy Egg
3. Unbounce
4. Instapage
5. HotjarSince these tools let you design, test, and change landing page elements, they’ll help you improve your user experience and likely boost conversions.
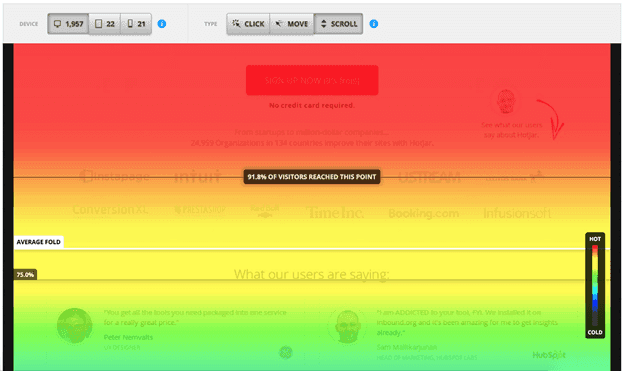
- Heat Maps and Scroll Maps
Heat maps and scroll maps give visual insights into landing page visitor behavior. Heat maps visually represent user interaction on your page, with warmer colors showing areas of higher engagement (clicks or cursor movement, for example), helping you see which elements attract the most attention. Here’s an example, courtesy of searchenginepeople.com: Source: https://www.searchenginepeople.com/blog/using-heatmaps-conversion-optimization.html
Scroll maps visually represent how far users scroll down a webpage before leaving it or engaging with it. Average scroll depth allows you to optimize content placement for improved conversion rates. Here’s a scroll map example from Hotjar:
 Source: https://www.hotjar.com/blog/scroll-maps/
- Mobile Optimization
Given the ever-growing number of people using mobile devices, optimizing your landing page–ensuring that it’s easily readable and usable on a mobile device–is critical.
Analyzing user behavior on various devices will ensure that your landing pages are responsive and fast-loading and offer a seamless experience across platforms.
Measure, Measure, and Measure: Make Metrics the Foundation of Landing Page Design
Mastering landing page analytics has become essential to creating and running effective landing pages. Generally, marketers can take away a few key points when looking at analytics:
- The primary metric to look at is Conversion Rate. Other data feeds into this specific metric, but the entire point is to get information or make sales.
- Engagement rates, scroll depth, and Time on Page are great ways to see if visitors find any value in your page. Even if there isn’t a direct conversion, a visit time of around two minutes (or readers scrolling past the midpoint of your page) is a good sign they are engaging with content.
- Information like devices and geolocation allow you to optimize content on a granular level so that no user is getting a lesser experience.
- Always make sure your landing page messaging aligns with your ad campaign keywords.
Ready to dive into the world of landing page development and Lead Generation? Well then… marketers, meet mathematics. Good marketing is a numbers game.