
TL;DR: Landing pages. They exist to convert visitors into leads. That’s why it’s time to put on your lab coat and break out the beakers to get into the nuts and bolts of how A/B testing works. By testing critical elements of your landing page, you can optimize it for exponential conversion growth.
So What? We don’t need to tell you how important your landing page is. We may need to remind you that it takes multiple iterations to get it right. With these A/B testing protips, you can start testing and improving immediately.
Why A/B Testing Matters for Marketers
Sometimes, we marketers need to put on our lab coats and figure out how (or even if) our landing pages are working. A/B testing (“split testing”) is a critical form of experimentation in our toolbox to isolate and test variables while optimizing landing page content.
In some ways, A/B tests are quite easy to deploy. They call for more thought and patience in other ways (like digging deep into your design and data to determine why a page is or is not converting). It takes a curious and clever mind, an understanding of the elements of a landing page, and how to read the data and develop something creative and effective.
Here, we’re diving into A/B testing, how to test different landing page components, and best practices for conducting your own experiments.
What is A/B Testing?
In an A/B test, you will compare two landing page versions to see which performs better regarding a specific objective. The two versions are nearly identical, except you’ll typically change one element that you suspect might influence user behavior.
This element could be a headline, a call-to-action button, an image, or even the overall layout (or at least one aspect of the layout). One version (often the current design) is the control, while the other contains the changes or optimizations you want to test.
Once your science experiment is ready for the world, you serve your landing page to an even 50% split of your target audience and see what comes from it.
This testing serves the basic purpose of optimizing your page and driving leads. And in that function, such tests have stood the test of time. According to Marketing Experiments, research has shown that A/B testing can improve conversion rates into the triple digits–one optimized page form increased lead conversion by 816%.
How Does it Work?
The actual deployment of an A/B test is relatively simple… in theory. You take your control page, create a copy with specific optimizations, and run each page against roughly 50% of your audience to see which works better.
On a deeper level, some detailed planning goes into such a test:
- Identifying Your Objectives: First, define your goal with the landing page. This could be increasing the number of signups, boosting sales, improving conversions, or other brand goals. Typically, these goals align with some performance issue–not getting enough signups or conversions to hit your sales objectives, for example.
- Selecting Variables for Testing: Choose the element or elements that could impact the landing page’s performance. The element that you choose will come directly from your objectives. For example, if you want to increase clicks on a CTA, you may start with variables associated with that CTA rather than optimizing content further down the page.
- Analyzing Results: The proof is in the pudding. If you have radically different results between the two, then your takeaways are probably clear. But smaller changes might call for different split tests, either of the same element or different ones.
Factors to Include with an A/B Test (with Examples)*
*All sample wireframes were built using Balsamiq.
Headlines and Subheadlines
The headline is often the first thing visitors see and can significantly influence their first impression. A compelling headline can grab attention and encourage further interaction, while a less-than-compelling headline can cause it to bounce immediately.
Likewise, subheaders (either supporting the main headline or labeling subsections of the page) can attract or deter readers.
And, before you think we’re making too much hay about simple headlines, we’ll note that a headline can make or break a page. Leadpages reports that a change in a single headline (through split testing) resulted in 300%+ conversion boost.
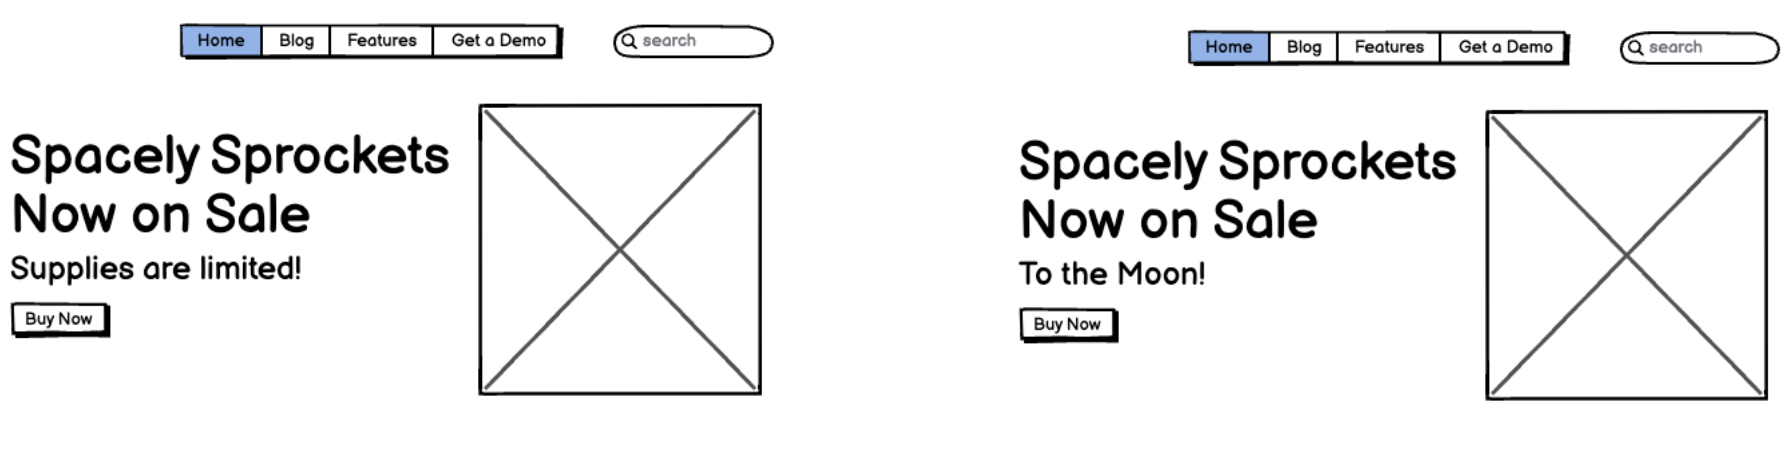
Here are two examples of A/B landing page tests. The first test changes the primary headline. Once you determine your winning headline, the second test could test the subheader.
First, we run an A/B test with two headlines:

Next, we take the winning headline and run a separate A/B test on the subheadline:
Marketer’s Protip: Some ways to shake up headlines for a split test include:
- Creating longer and shorter versions of headlines
- Asking questions vs. making statements with headlines
- Expressing a more positive emotion through a headline
- Including a quote or testimonial in a headline
Call-to-Action (CTA) Buttons
The CTA is crucial for conversions. How your call to action simply and attractively conveys some sort of behavior or benefit to the reader can mean the difference between a click and a bounce.
Testing various aspects can help you understand which version encourages more clicks, leading to more conversions. It could be a simple color change or completely moving where the conversion mechanism is located.
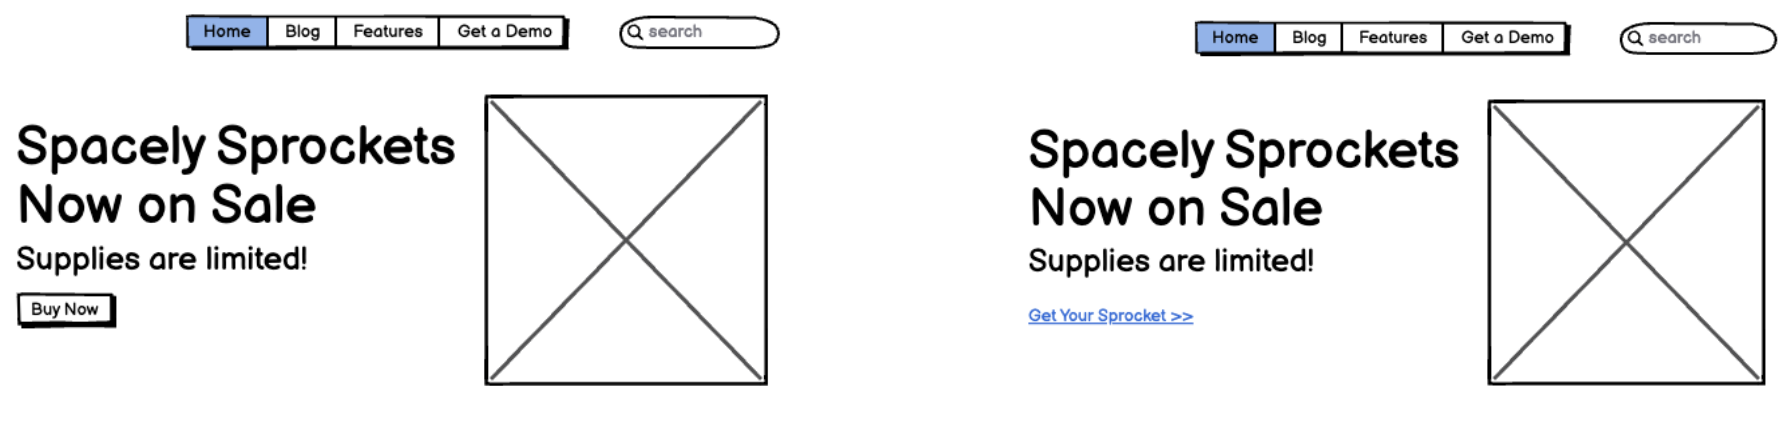
Here’s an A/B test changing the CTA button text:
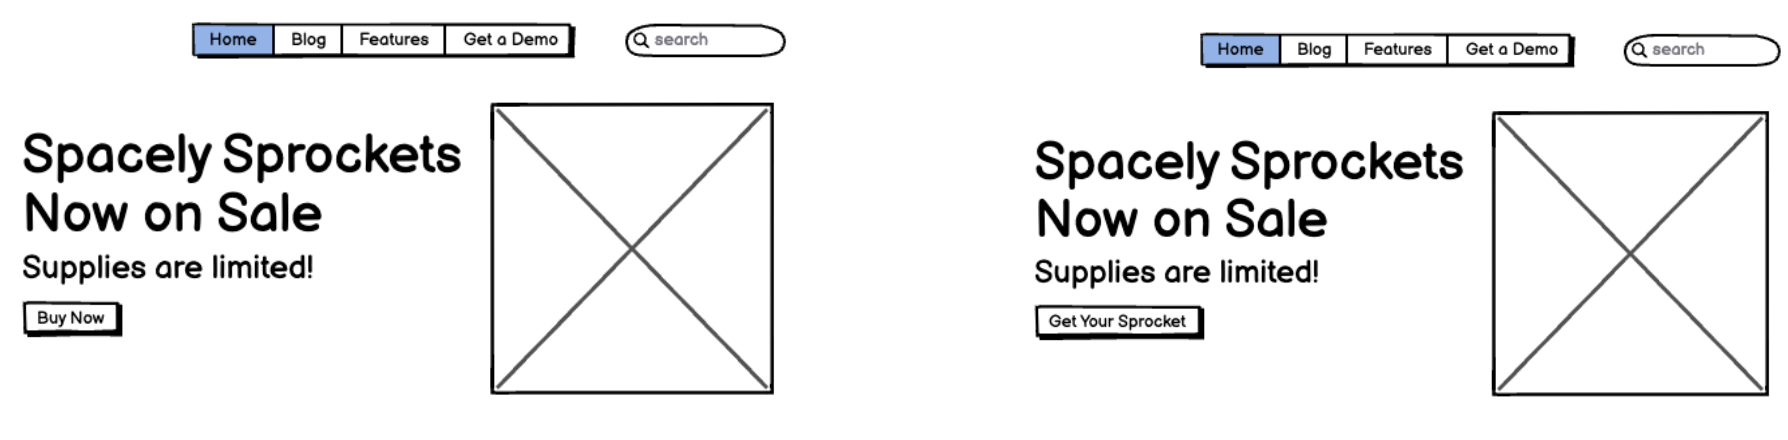
Here’s another A/B test changing the CTA button to a link:
Marketer’s Protip: Not all CTAs are created equal. For a landing page conversion, however, they should be prominent, graphical, and easy to see at first glance. For CTAs like buttons, you can test a variety of factors like color, shape, and placement relatively easily without getting into more extensive interactive elements like forms.
Remember that you typically only want one conversion point on your landing page. A study from Marketing Experiments shows that adding a secondary conversion mechanism can decrease lead conversion by over 200%.
Forms and Input Fields
Forms are a complex beast. You want to gather as much information from a user as possible, but each field creates more friction which reduces response rates. Most marketers will want as much data as possible, but the simpler you can keep your form, the more conversions you will receive.
When you’re debating whether to make the form longer (to better qualify your leads), or whether to keep them shorter (to get more leads), an A/B test can be useful. For example:
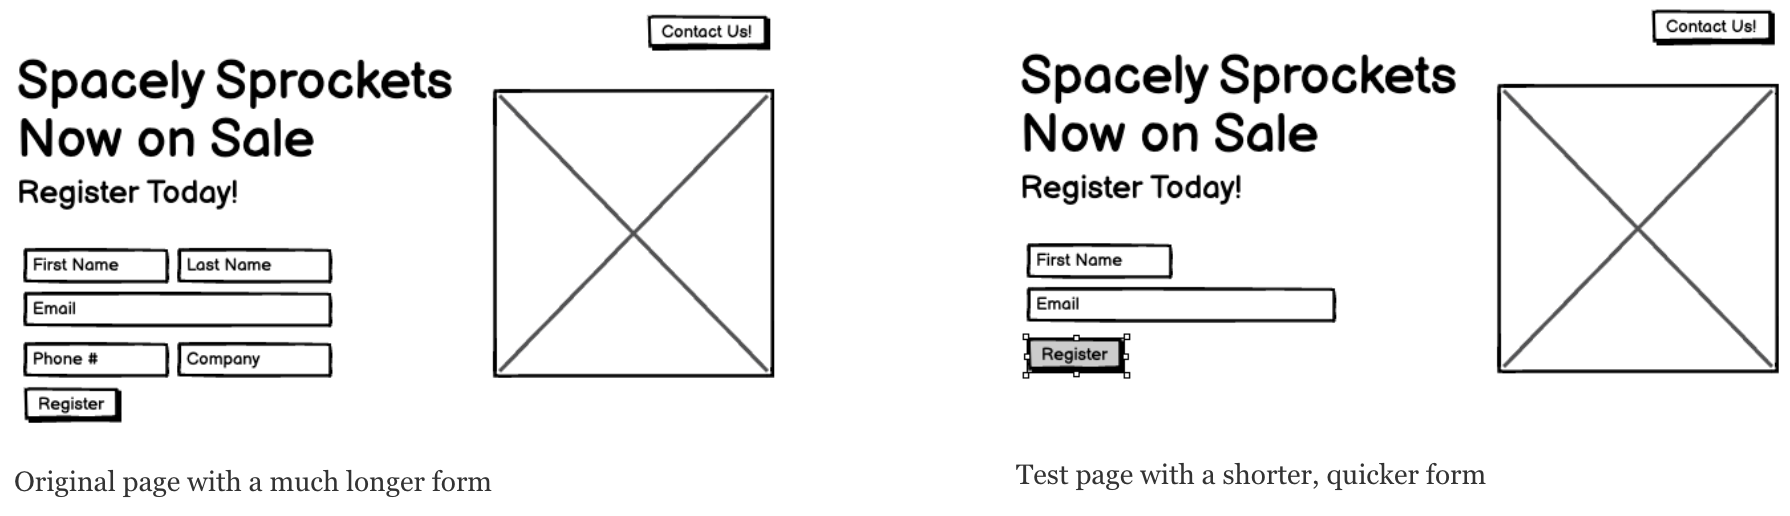 The original page with a much longer form (left), and the test page with a shorter, quicker form (right).
Consider these statistics:
- The Mean conversion rate for online forms is roughly 21.5% (WPForms).
- The average form length in 2019 was five fields. In 2023, most experts recommend three (Hubspot).
- On average, only 66% of users will complete a form, with the time they are willing to spend on that form varies depending on the offer (Zuko Analytics).
Marketer’s Protip: Forms can come in many shapes and sizes, but don’t reinvent the wheel. Keep forms as simple as possible, balancing the needs of your lead qualification process and sales team.
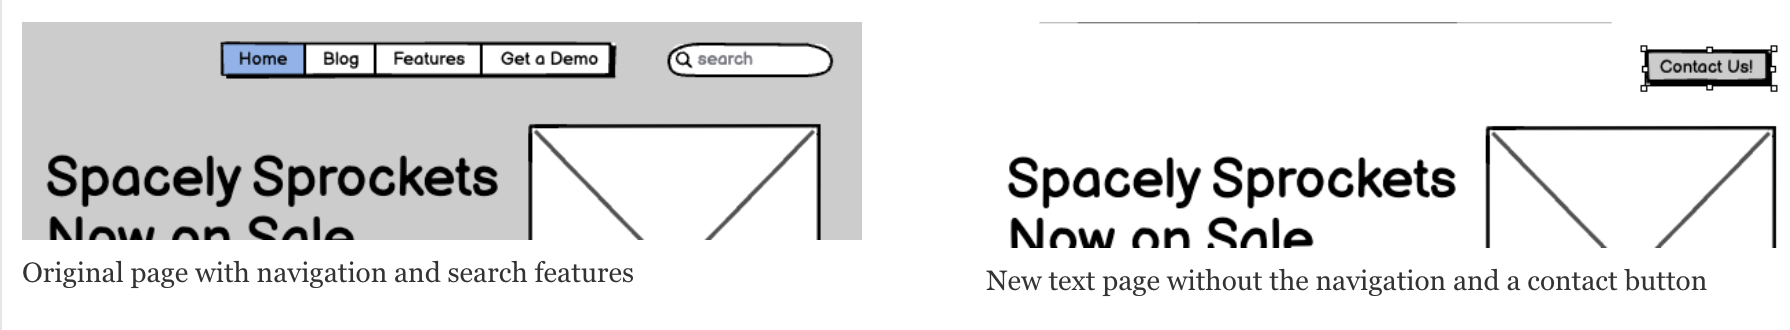
Navigation
Quick question: Why would you want a user to leave your landing page?
The answer is you don’t. According to Hubspot, only 16% of landing pages leave off navigation links, even though they cost leads.
When kitchen tool distributor Yuppiechef conducted an A/B test on their navigation, they found that removing their navigation increased signups by over 100%. If your users only have one button to click, guess what? More of them will click the button.
This seems to be a no-brainer, but if you’re currently using navigation, a quick split test utilizing a page without such navigation will probably show you the wonders of removing the navbar and keeping your readers on your landing page.
Marketer’s Protip: You’ve spent time and money to get your users to your landing page. Don’t waste it. You already know that dropping navigation links will improve landing page performance. But, if you want to test for efficacy, A/B test one page with and one without.
Imagery and Videos
Visual elements evoke emotional responses that text cannot, potentially influencing how a visitor perceives your product or service. Often, images are the first (and primary) element a reader will react to.
A report from Gitnux Market Data even showed that adding a single image to a landing page in A/B tests increased purchasing by up to 60%.
The opportunity from split testing imagery is that there are plenty of ways to address potential conversion issues. Image placement can be a factor, but so can something as simple as the color grade, or the inclusion of people versus animations or stock photos.
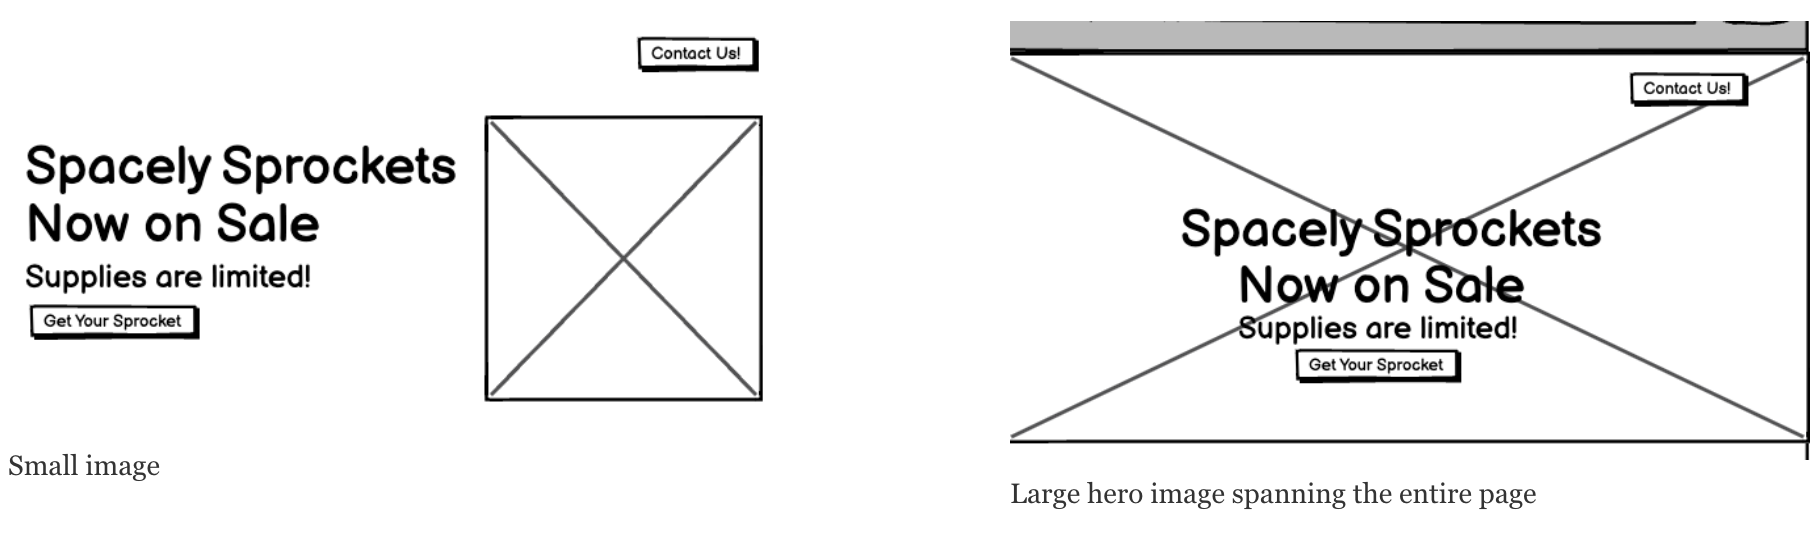 An A/B test between a small image (left), and a large hero image spanning the entire page (right).
Marketer’s Protip: When testing image variables, only do so on a single image, not every image on your page. You want to isolate single elements if possible.
That being said, if you’re testing layout (see below), you will most likely manipulate multiple images. That’s why it’s important to determine what you’re testing, and for what purpose.
Also, while you can test an image against a video clip or animation, consider the difference in media. Your readers might prefer video, but the test doesn’t tell you what about the video they like. Which means more A/B testing of your video.
Content
Content is subjective, so basic language, tone, style, length, or placement changes can greatly impact how the landing page converts.
Content, like any element on your page, is also subject to placement issues. More text upfront can turn off a reader before they even read anything. Poor formatting (color choices, font choices, etc.) can make reading difficult, creating friction where you want to reduce it.
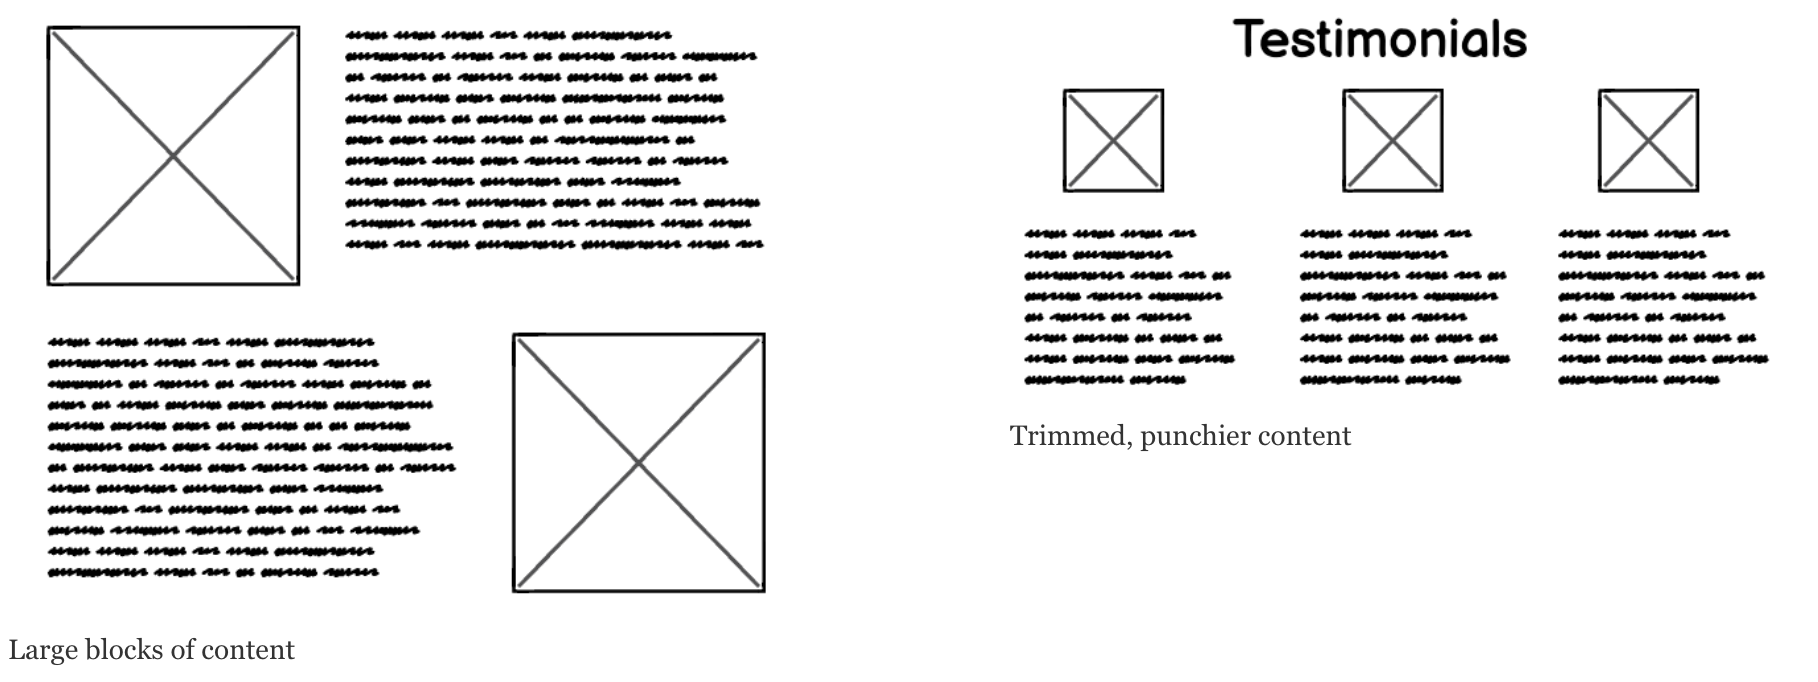
A/B test with the original page containing large blocks of content (left), vs. the test page with trimmed, punchier content.
Marketer’s Protip: When A/B testing content, consider density and placement first:
- Is there too much?
- Does it distract from other important elements like the CTA?
- Is it crowding out other elements?
- Does it intimidate the reader?
Following that examination, you can drill down into wording choices and messaging.
Layout and Design
A cluttered or confusing layout may discourage interaction, whereas a clean, intuitive design can improve it.
Some A/B tests for layout can include radically altering color schemes, changing hero banner types, manipulating navigation placement, and other steps.
Others will involve smaller changes, like switching the placement of content and images or increasing padding around different elements to determine how easy it is for the viewer to take in the page.
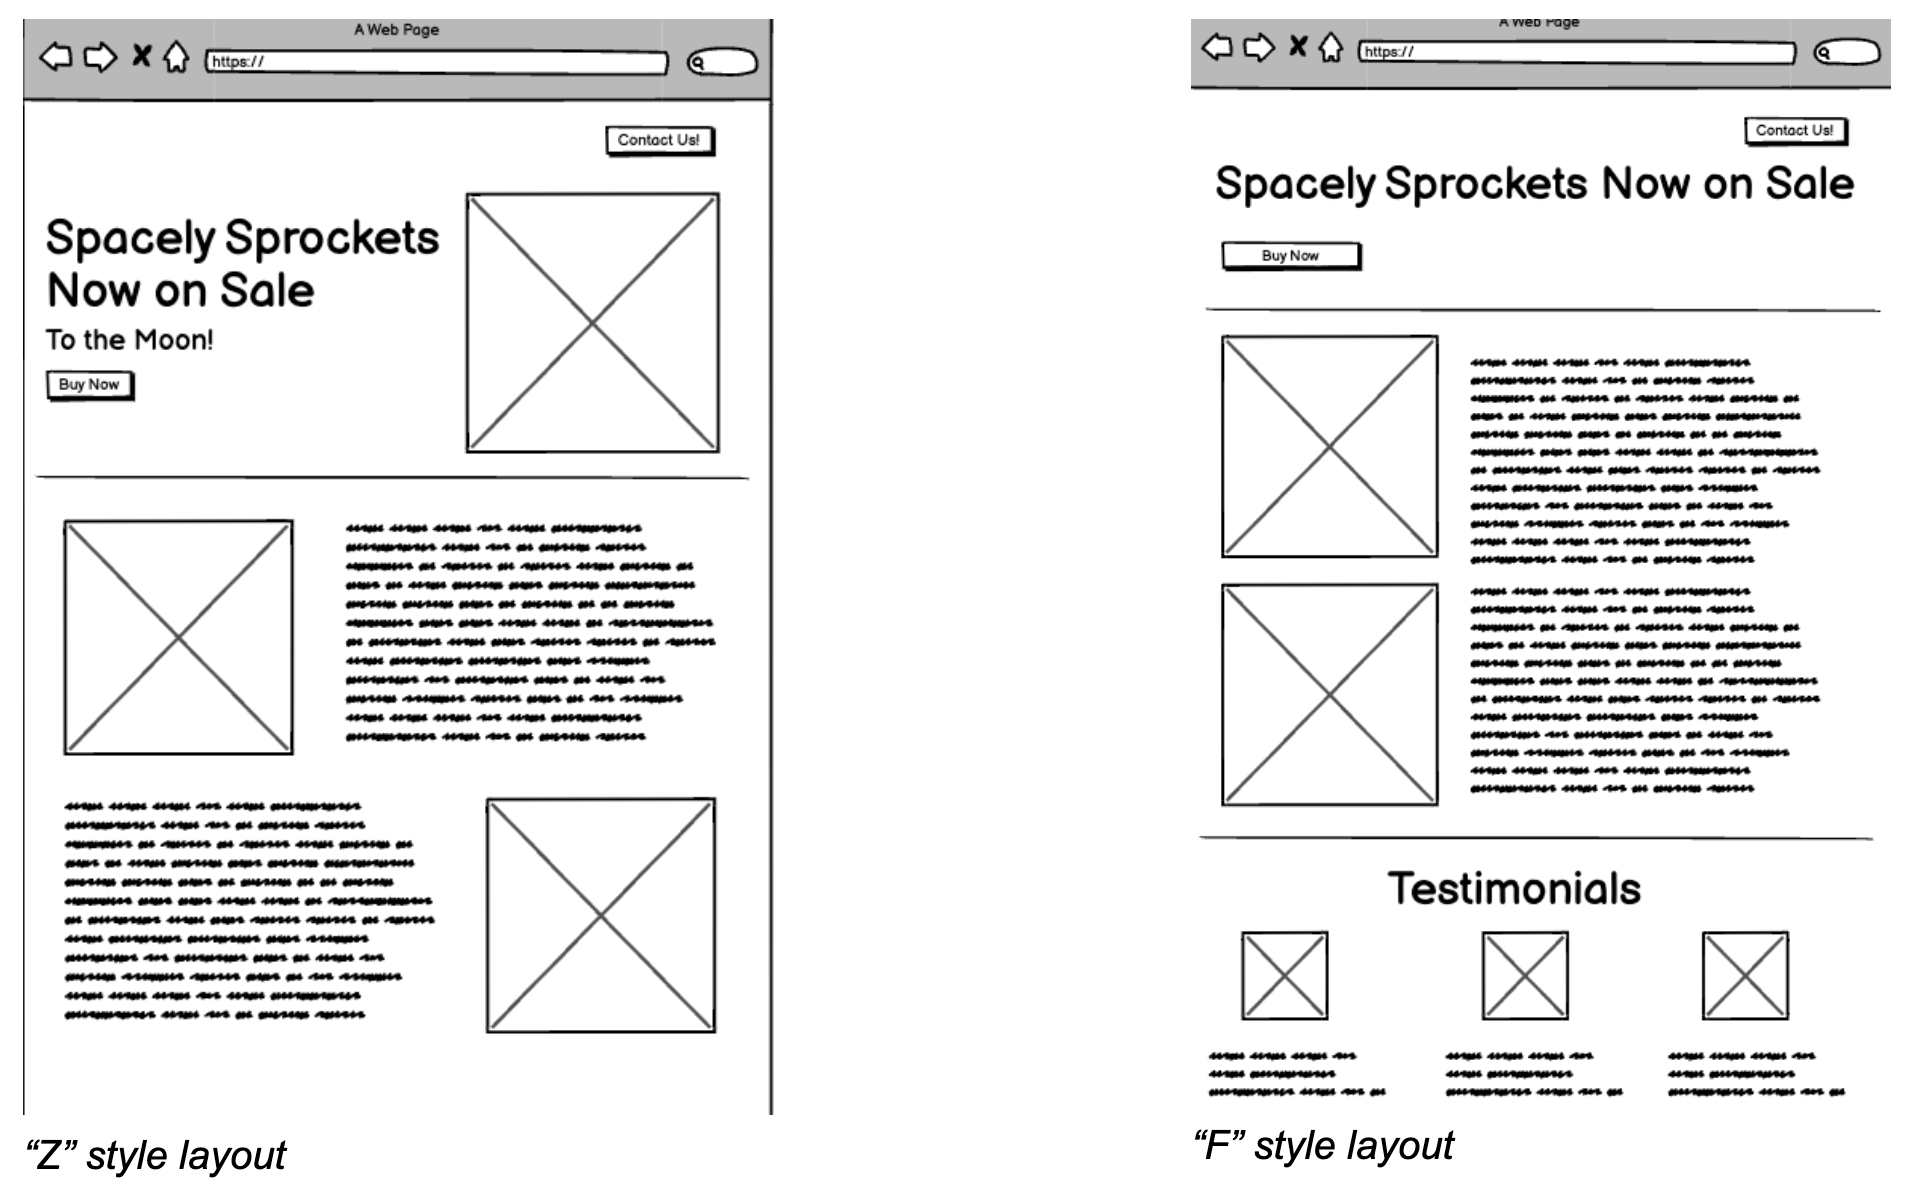 The original page with a “Z” style layout (left) and the test page with an “F” style layout (right).
Marketer’s Protip: Research has shown that we read pages left-to-right in either an ‘F’ shape or a ‘Z’ shape.
- F-shaped layouts tend to support more dense or content-heavy pages.
- Z-shaped layouts support smaller pages with less text and alternating image-text structures.
It’s a good idea to follow these rules of thumb but test different layouts to see if user engagement has marked differences.
Best Practices for A/B Testing

Regardless of the test you are running, there are some basic best practices to ensure that you’re actually testing elements of a landing page rather than just running two different pages (and splitting your results).
Some practices to consider are:
- Start with a Hypothesis: You should know what you want and how to achieve it. Have an idea of what you want to accomplish and the elements that can support or hinder that goal.
- Limit the Number of Variables: Only test one thing at a time. The clarity of your variables determines the clarity of your results. Note, however, that if you’re testing your layout or cutting content size, you may have to adjust multiple components to see how your test works.
- Sample Size and Duration: There are disagreements about how long to run an A/B test, but opinion seems to circle one or two weeks. It’s more important, however, that you get a sample size commensurate with your audience size to draw good conclusions.
- Use Consistent Metrics: Pick metrics that directly relate to your goals. Keep it simple: if you’re measuring conversions, focus on pageviews, clicks, and conversions. Avoid getting sucked down reporting rabbit holes.
- Analyze and Act on Data: It’s not just collecting data but interpreting it that brings value. Use your best marketing and UX experts to provide reasoning for your results and, if necessary, suggest further testing.
Marketer’s Takeaway
We know, as a marketer, you probably didn’t go into science for a reason. But when you’re ready to roll up your sleeves, the science of landing page A/B testing can be rewarding and profitable.
Once customers hit the landing page, the rubber meets the road–and your pages need to deliver. Optimization of these pages drives your marketing results, and optimization only comes with testing, testing, and more testing.
If you’re looking for a creative partner who can help you optimize landing pages and deliver the content needed to stick the landing for conversions, consider Media Shower.
Try Media Shower for free. The award-winning content platform.