
TLDR: We are excited to unveil our new reporting system for all Media Shower clients, which will turbocharge your marketing results. Over a year in the making, our new dashboard shows you top-performing content, SEO rankings over time, and content optimization opportunities – helping you drive real marketing results in the form of new leads and customers.
So What? Our new reporting dashboard gives marketing managers a powerful new way to show content marketing results, and how they’re affecting your bottom line. You get personalized, detailed breakdowns of the way your content resonates with audiences, so you can refine your content strategy to build more of what works, and turn more content consumers into customers.
How It Works
At Media Shower, we’re constantly improving. When we get better, our clients get better. And we’ve taken a big step forward with our improved content reporting dashboard, which was designed from the ground up to get our clients more website traffic, leads, and customers.
This dashboard pulls data directly from Ahrefs, which we found through extensive testing to be the single best source of SEO data out there – better than Semrush, better than BrightEdge, better than Moz. We received the opportunity to become one of Ahrefs’ first API partners, which means you now get access to Ahrefs data for the cost of your Media Shower subscription. No additional charge!
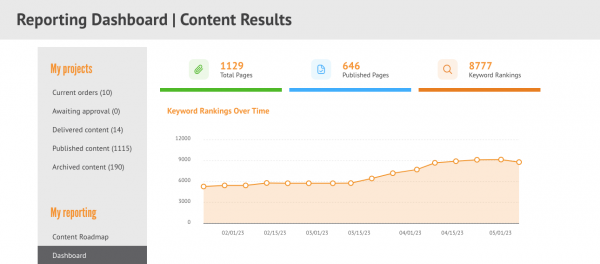
When you open your new reporting dashboard, you’ll see three separate (orange) numbers at the top.
- On the far left, above the green line, will be “Total Pages,” the number of posts Media Shower has created for you.
- In the middle, over the blue line, you’ll see the number of “Published Pages,” the total number of posts we’ve created that have been posted to your site.
- Finally, on the right above the orange line, you’ll see what’s hopefully the largest of the three numbers: “Keyword Rankings.” This number indicates how well your website is ranking across all of your keywords. It shows the aggregate – over all your published pages – of your keyword rankings.
Quick explainer: When you have a web page show up in a search engine, there may be multiple keywords ranking on a particular page. For example, as in our graphic below, a blog post about “cryptocurrency mining rigs” — customized PCs built to perform crypto mining – might show up in Google for the keywords “mining rigs,” “crypto mining rigs,” “best mining rigs,” and many others.
At Media Shower, we take these keyword rankings seriously, because this is the power of the content we create. The more keywords on which your posts are ranking, the more traffic you’re getting to that page, because more people are finding it in response to search queries.
- Remember: a page created by Media Shower can have multiple keywords ranking at any time. The bigger this number, the more people who can find your site through online searches.
Below all three of these numbers across the top, you’ll see a chart with “Keyword Rankings Over Time.” This chart shows the number of keywords for which all your pages ranked over the last several months. Ideally, the line on this chart will be tracking upward.
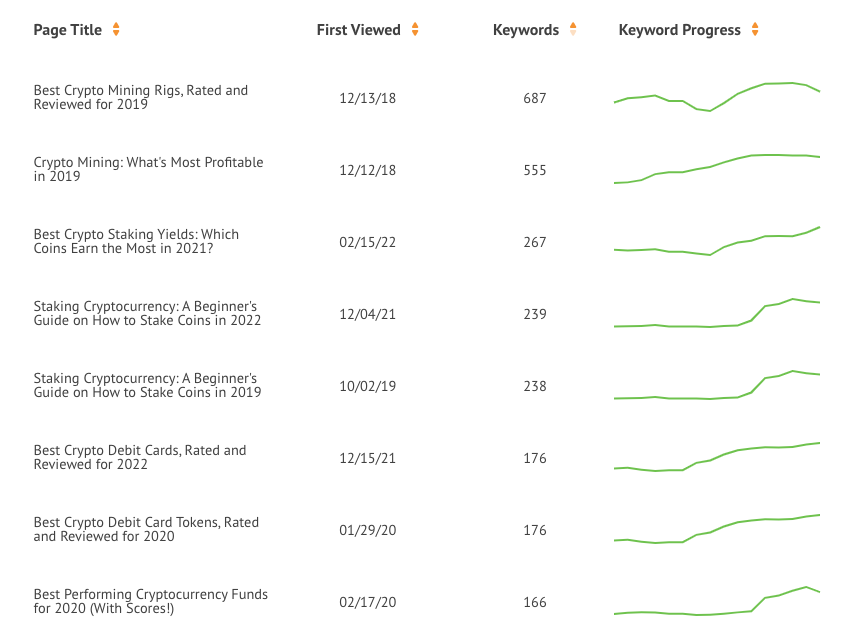
Under the graph, you’ll see a section with four columns:
- “Page Title” gives you the titles of the individual pages or posts we’ve created for you.
- “First Viewed” gives you the date on which we first started tracking each page.
- “Keywords” shows the total number of keywords ranking on each of those pages or posts.
- “Keyword Progress” is a graph giving you a quick visual summary of how each of these posts have performed over time.
Why you need this data: Using this information, you can get a solid reading of your content’s overall search engine traction, as well as where you can optimize. This is a content report that’s not available in any other tool. If the line is going up, great! If it’s going down, time to optimize or improve!
It’s this ability to see your content optimization opportunities that makes this report so powerful. Looking at a big list of SEO rankings doesn’t cut it: you need a quick visual on which pages are doing best, and when they’re starting to decline. Perhaps those pages are out of date or they’re no longer doing a good job of answering particular search queries. Now you can pinpoint the problem areas, quickly and effectively.
Whatever the problem, we can help you solve it by identifying optimization opportunities. We can refresh underperforming posts with new data, examine trends and sources, and republish. Once the pages have been optimized, you can come back to your dashboard in the next few weeks to see the effects on your rankings. Again, no other reporting tool shows you content optimization results in such an easy way.
Publish, test, optimize. Publish, test, optimize. This is how you generate truly world-class content marketing results.
At an even more granular level are our individual keyword progress charts. There’s one of these for each of your pages or posts, as in the example below:
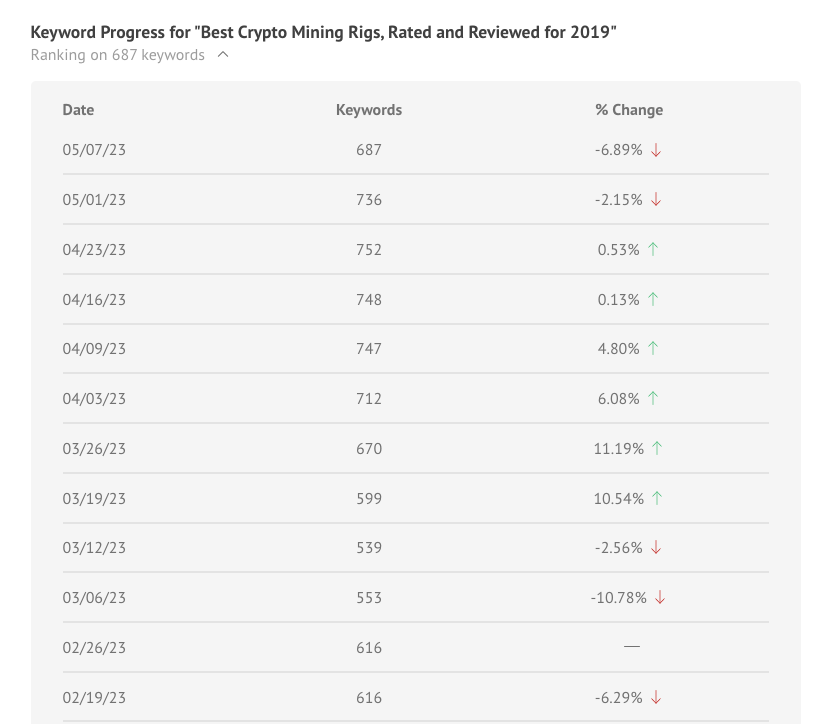
For example, on April 9, one of your posts might have been ranking on 747 keywords, an increase of 4.8% since the previous week. But by May 7, you see that the numbers are declining, which is a signal it may be time to refresh the page to make it more up to date.
Why you need this data: Content is competitive. As soon as you hit Google Page 1, your competitors will be working to produce content that’s even better than yours. By monitoring which pages are pulling in the most traffic, and correcting them quickly when competition arrives, you can 10x your marketing results.
Our goal is to get our clients thousands of search engine content rankings, millions of organic pageviews, and hundreds of new customers.
If you’re a Media Shower client, our new reporting system is now part of your subscription at no extra charge. If you’d like a demonstration, please contact us for a quick walkthrough.