
We’ve done our fair share of infographics for our clients and always return to the basics: simplicity and storytelling.
Using data as a catalyst and framework, we find that B2B infographics are most effective when your data tells a story.
That doesn’t mean, however, that all data and all stories are created equal.
In this guide, we’re sharing our favorite tips and examples of B2B infographics, discussing what works, what doesn’t, and how you can use infographics to enhance any campaign.
What’s a B2B Infographic?
Infographics convey complex or detailed information in an easy-to-read visual format.
For B2B marketers, infographics are valuable tools in getting messages to audiences. B2B infographics usually deal with industry-specific numbers, statistics, and business processes, catering to a more professional, niche audience. They visually explain business strategies, operations, and market trends.
Must-Have Elements for B2B Infographics
The best B2B infographics include:
- Striking visuals that grab readers’ attention while getting across your core message.
- Data visualization like easy-to-read charts and graphs that quickly convey meaningful information.
- Succinct text that gives your audience skimmable insights in bite-sized chunks.
Effective infographics also have:
Targeted Messaging: They are specifically tailored to address the needs, challenges, and interests of their target business audience, either with unique data or by presenting information in some novel way.
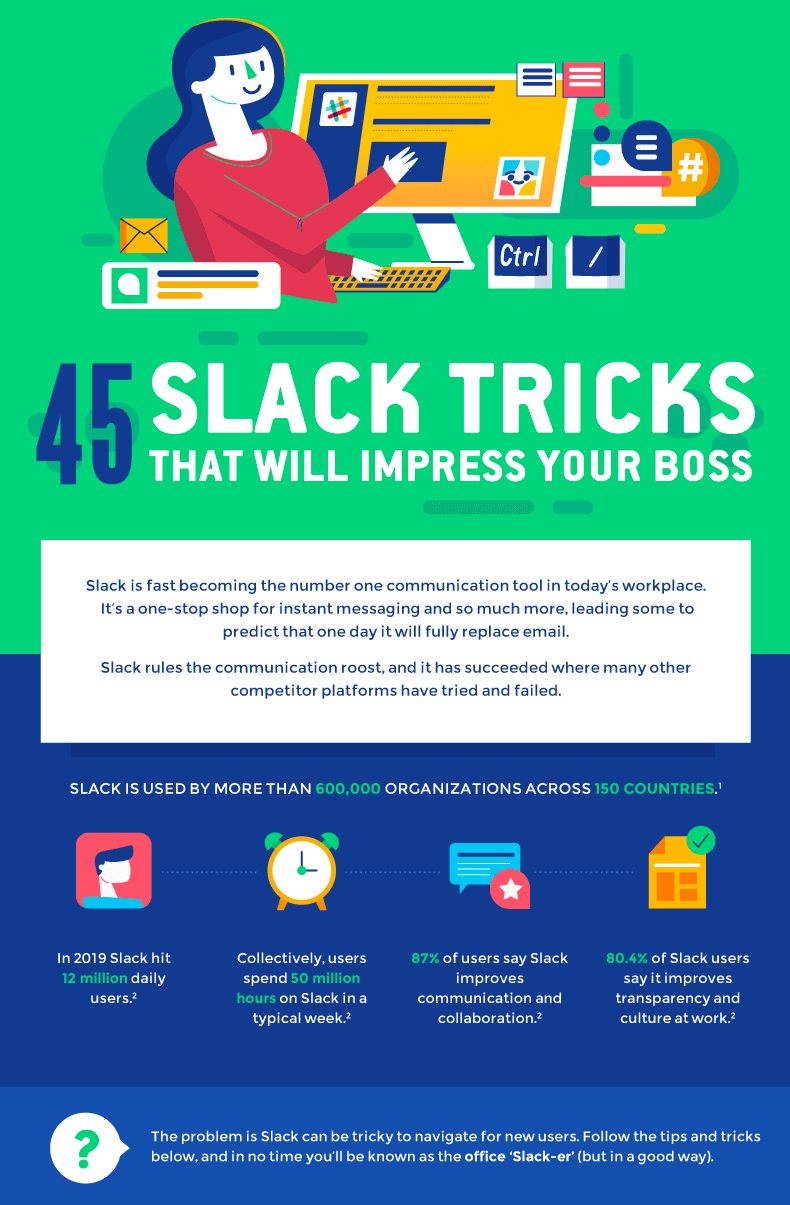
Example: “45 Slack Tricks to Impress Your Boss” (NetCredit)
Data-Driven Insights: Effective B2B infographics are often grounded in proprietary data (best), or trustworthy data, surveys or research (just be sure to credit your sources).
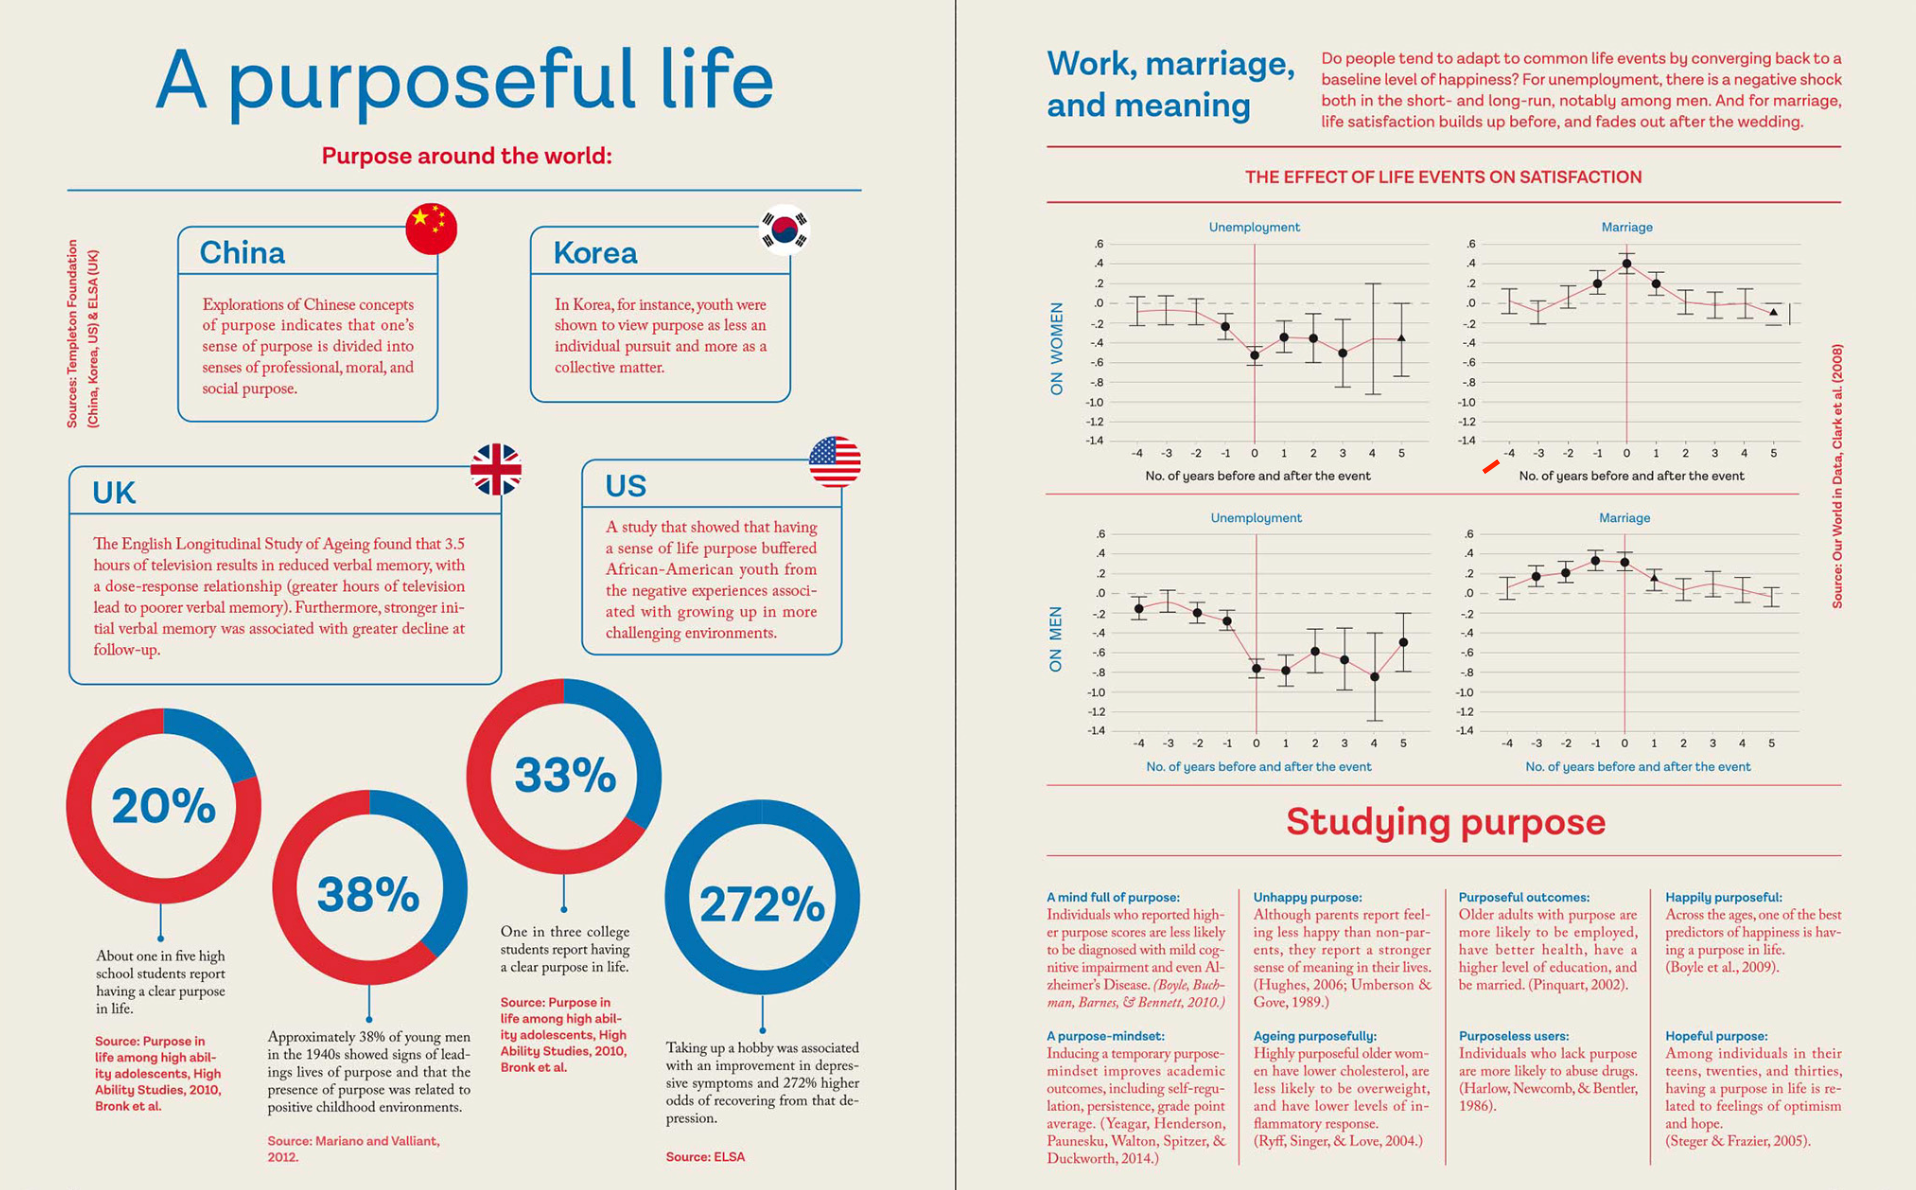
Example: “A Purposeful Life” (Behance)
Clear and Concise Communication: They break down complex information into digestible nuggets. Simplicity is difficult, so reduce until you can’t take anything else away.
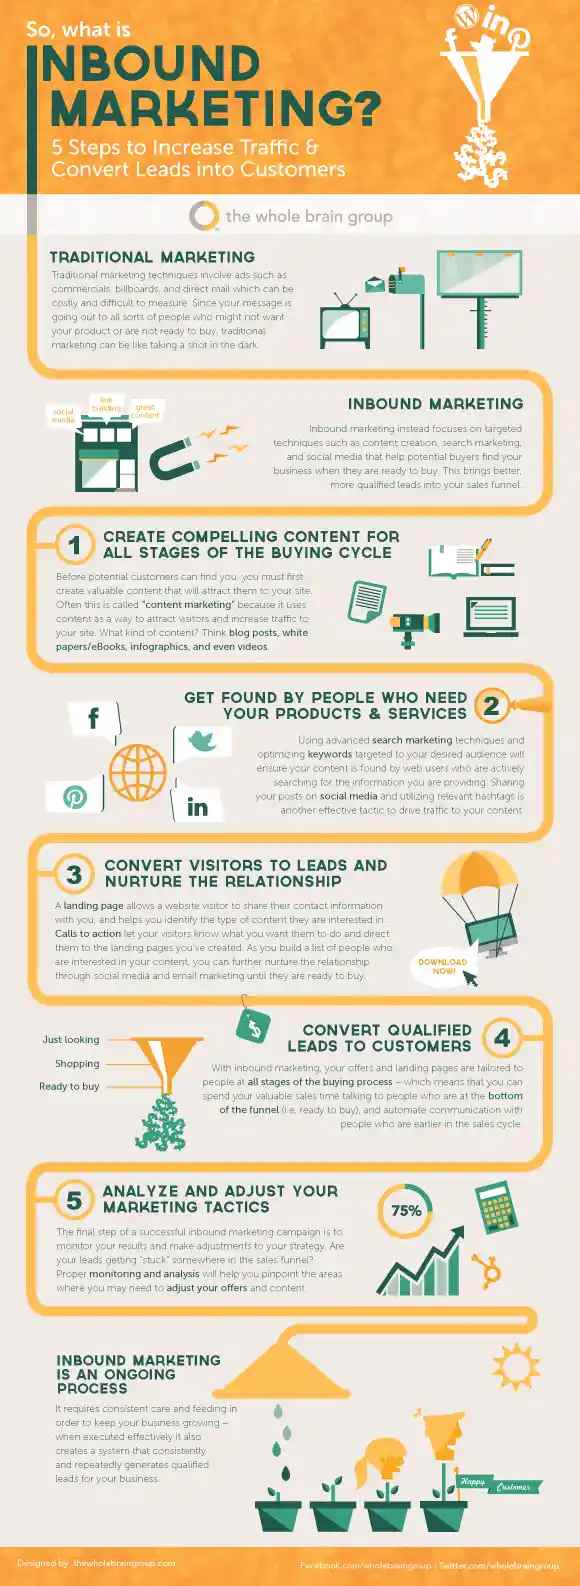
Example: “Inbound Marketing? 5 Steps to Increase Traffic & Convert Leads into Customers” (Hubspot)
Strong Narrative Flow: Effective infographics tell a story, with a beginning, middle, and end.
Example: “The Carbon Budget” (World Resources Institute)
High-Quality Visual Elements: Use charts, graphs, icons, and images, professionally designed, in line with your brand style.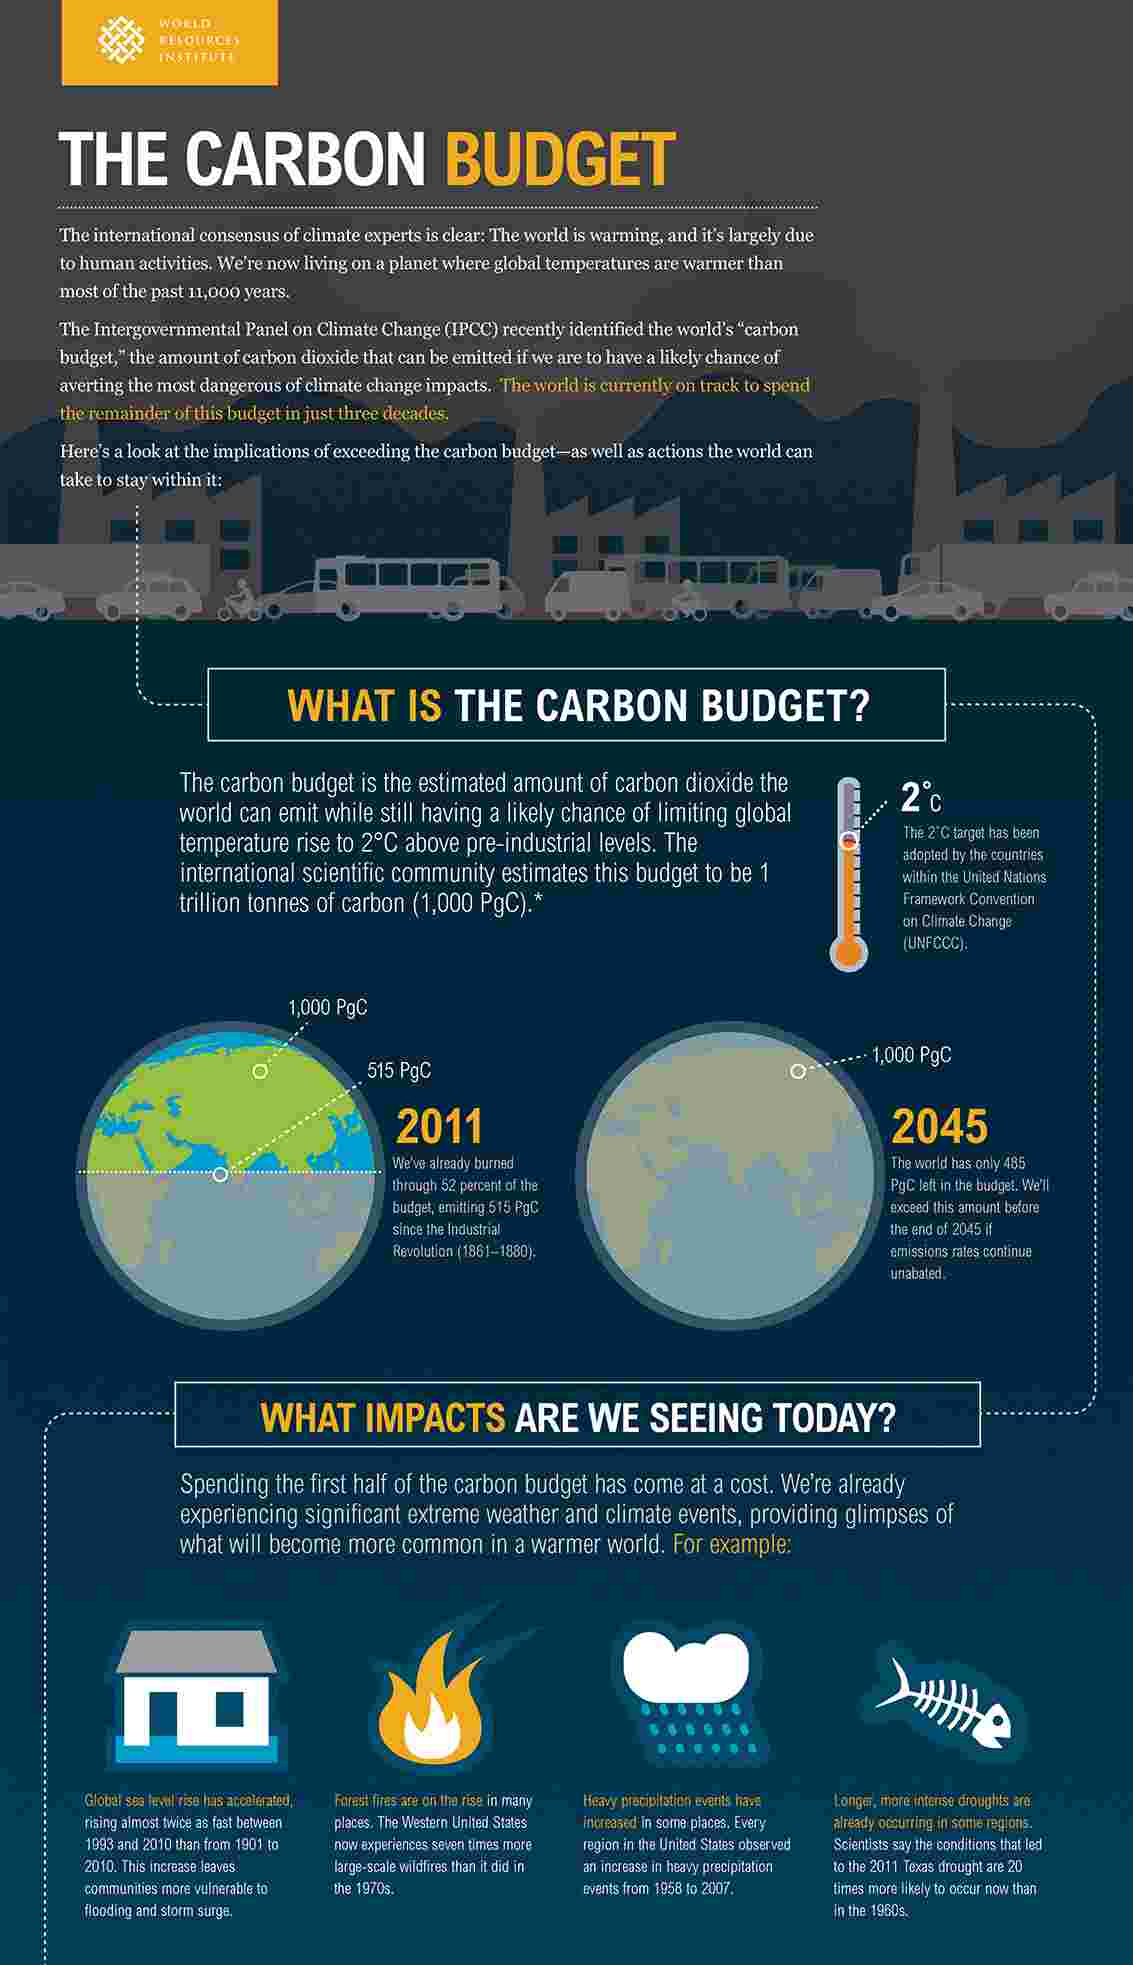
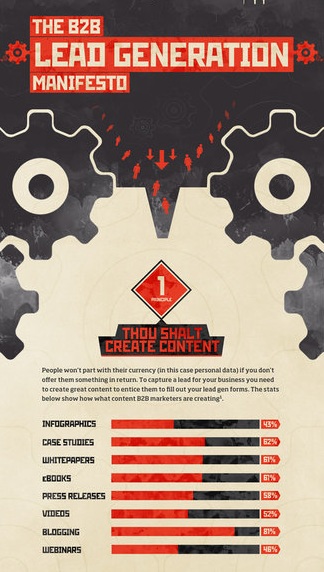
Example: “The B2B Lead Generation Manifesto” (Unbounce)
Together, these elements will help make your B2B infographics eye-catching, exciting, and informative, making your audience want to learn more.
B2B Infographic Best Practices

Make Numbers Your Foundation
In B2B infographics, data is the star. Make sure the data you’re presenting is accurate and relevant and that it aligns with the interests and needs of your target audience. Prioritize topline metrics, industry-specific statistics, and data points that support your overall message.
Simplify complex data sets with visually appealing charts, graphs, and diagrams (but keep a balance between depth and accessibility).
See here for an infographic that successfully places data at center stage.
Tell a Story With Data
Standout B2B infographics go beyond raw data, however. Incorporate storytelling elements to engage your audience. Use a narrative structure to organize information in a logical flow that guides the reader through the story your brand is telling, highlighting the significance of the data. Make your transitions from data point to point seamless using a logical flow with harmonious visual elements.
Here’s a great example of a B2B infographic with elements that work together to tell a cohesive, understandable, and compelling story.
Use Clear Content
Remember to keep clarity in mind when crafting B2B infographics. Simplify the language, stay accurate, and use clean, uncluttered designs. Avoid information overload by focusing on key messages and using whitespace to offset particularly critical information.
Not sure it’s clear enough? Test the clarity by asking for feedback from people unfamiliar with the subject matter. If they understand it easily, your message is clear. A good example of what we mean can be found here.
Get Your CTAs Right
Integrating clear calls to action (CTAs) into your infographics can boost engagement and get the desired responses from your audience. Whether it’s encouraging users to explore your website, contact your business, or fill out a form, well-placed CTAs that align with the overall goals of your B2B marketing strategy can foster immediate action.
Need some inspiration? Check out some of the CTAs in these infographics.
Make it Accessible
You want to make your infographic accessible to as many people as possible. Optimize it for different devices, ensuring the visual elements and text are legible on various screen types and sizes.
In addition, provide alternative text for images to accommodate e-readers. Choose color palettes with sufficient contrast between the shades, and use easy-to-decipher fonts that enhance readability. Making your infographic widely accessible means you broaden your message’s reach. Here’s an excellent example.
B2B Infographic Examples
Here, we share a few more well-executed B2B infographics from the web. Notice how these use many of the best practices we outlined above.
Example 1: Asana
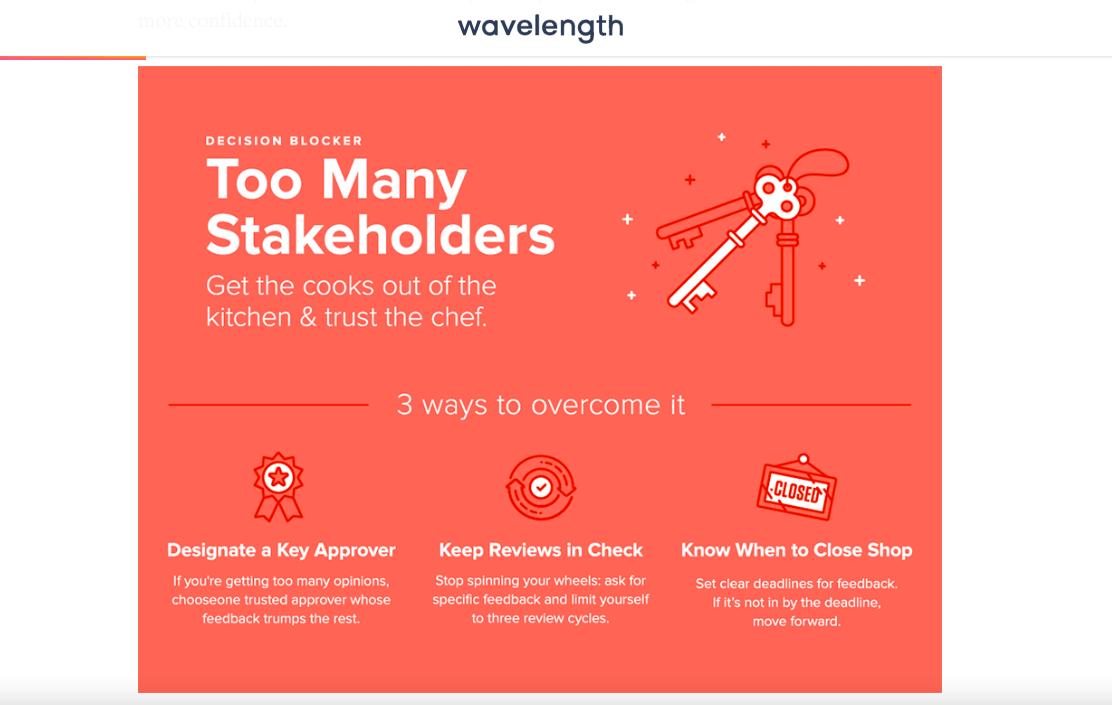
This series of small, bit-size infographics provides excellent information for readers to digest quickly and effectively. These could have been a single document, but separating the three into individual pieces makes for better social media teasers.
Example 2: Slack
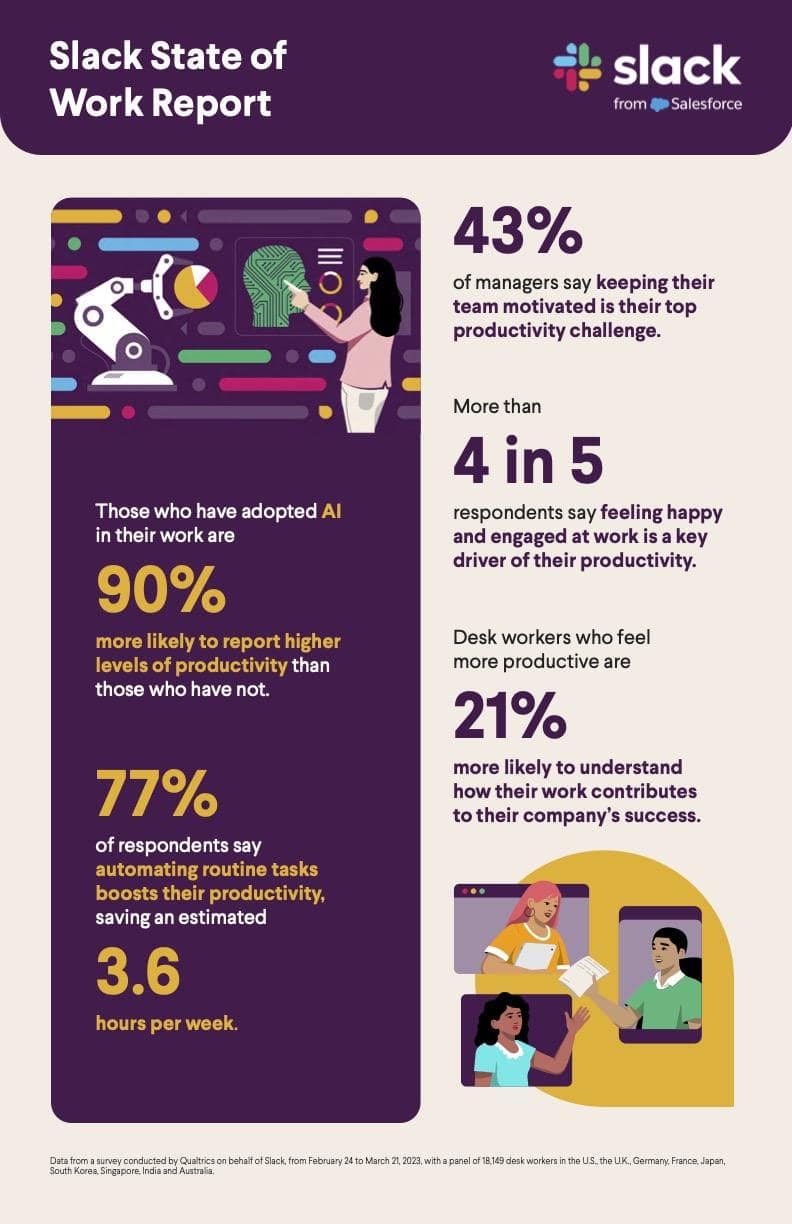
Infographics are often great lead-in pieces for more expansive content. This infographic from Slack condenses a major report released by the company, providing a way for interested readers to get a bird’s-eye view of the information without committing. But, it also entices by just giving enough information to tease deeper insights that the reader would find in the more extended report.
Example 3: Hubspot
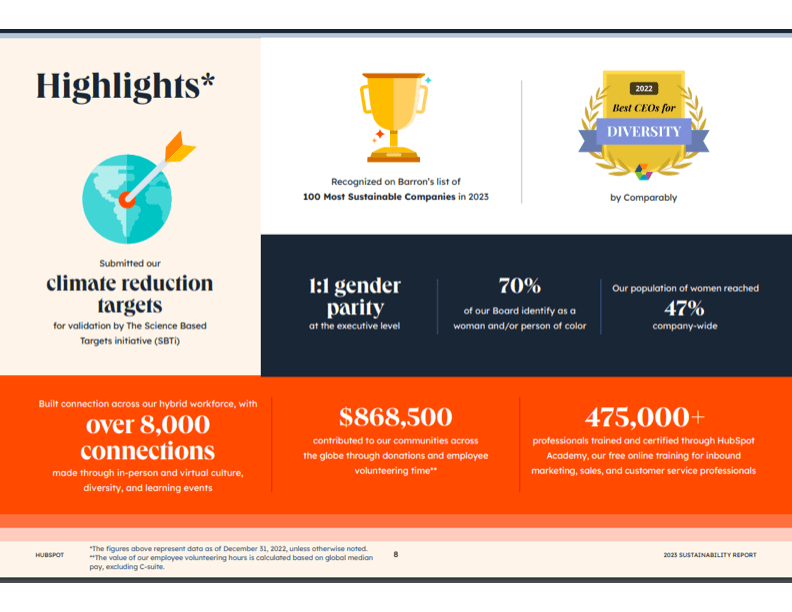
Another infographic that leads into a larger asset, this “climate reduction target” summarizes a more extended web page and embedded video. It’s effective at delivering data quickly and easily.
Marketer’s Takeaway
Effective B2B infographics result from great design and great storytelling. Incorporating data-driven statistics and finding a clear narrative are the best ways to elevate your marketing infographics and drive more business.
__________________
Need a hand with your B2B marketing strategy? Contact Media Shower today to see how we can help.